

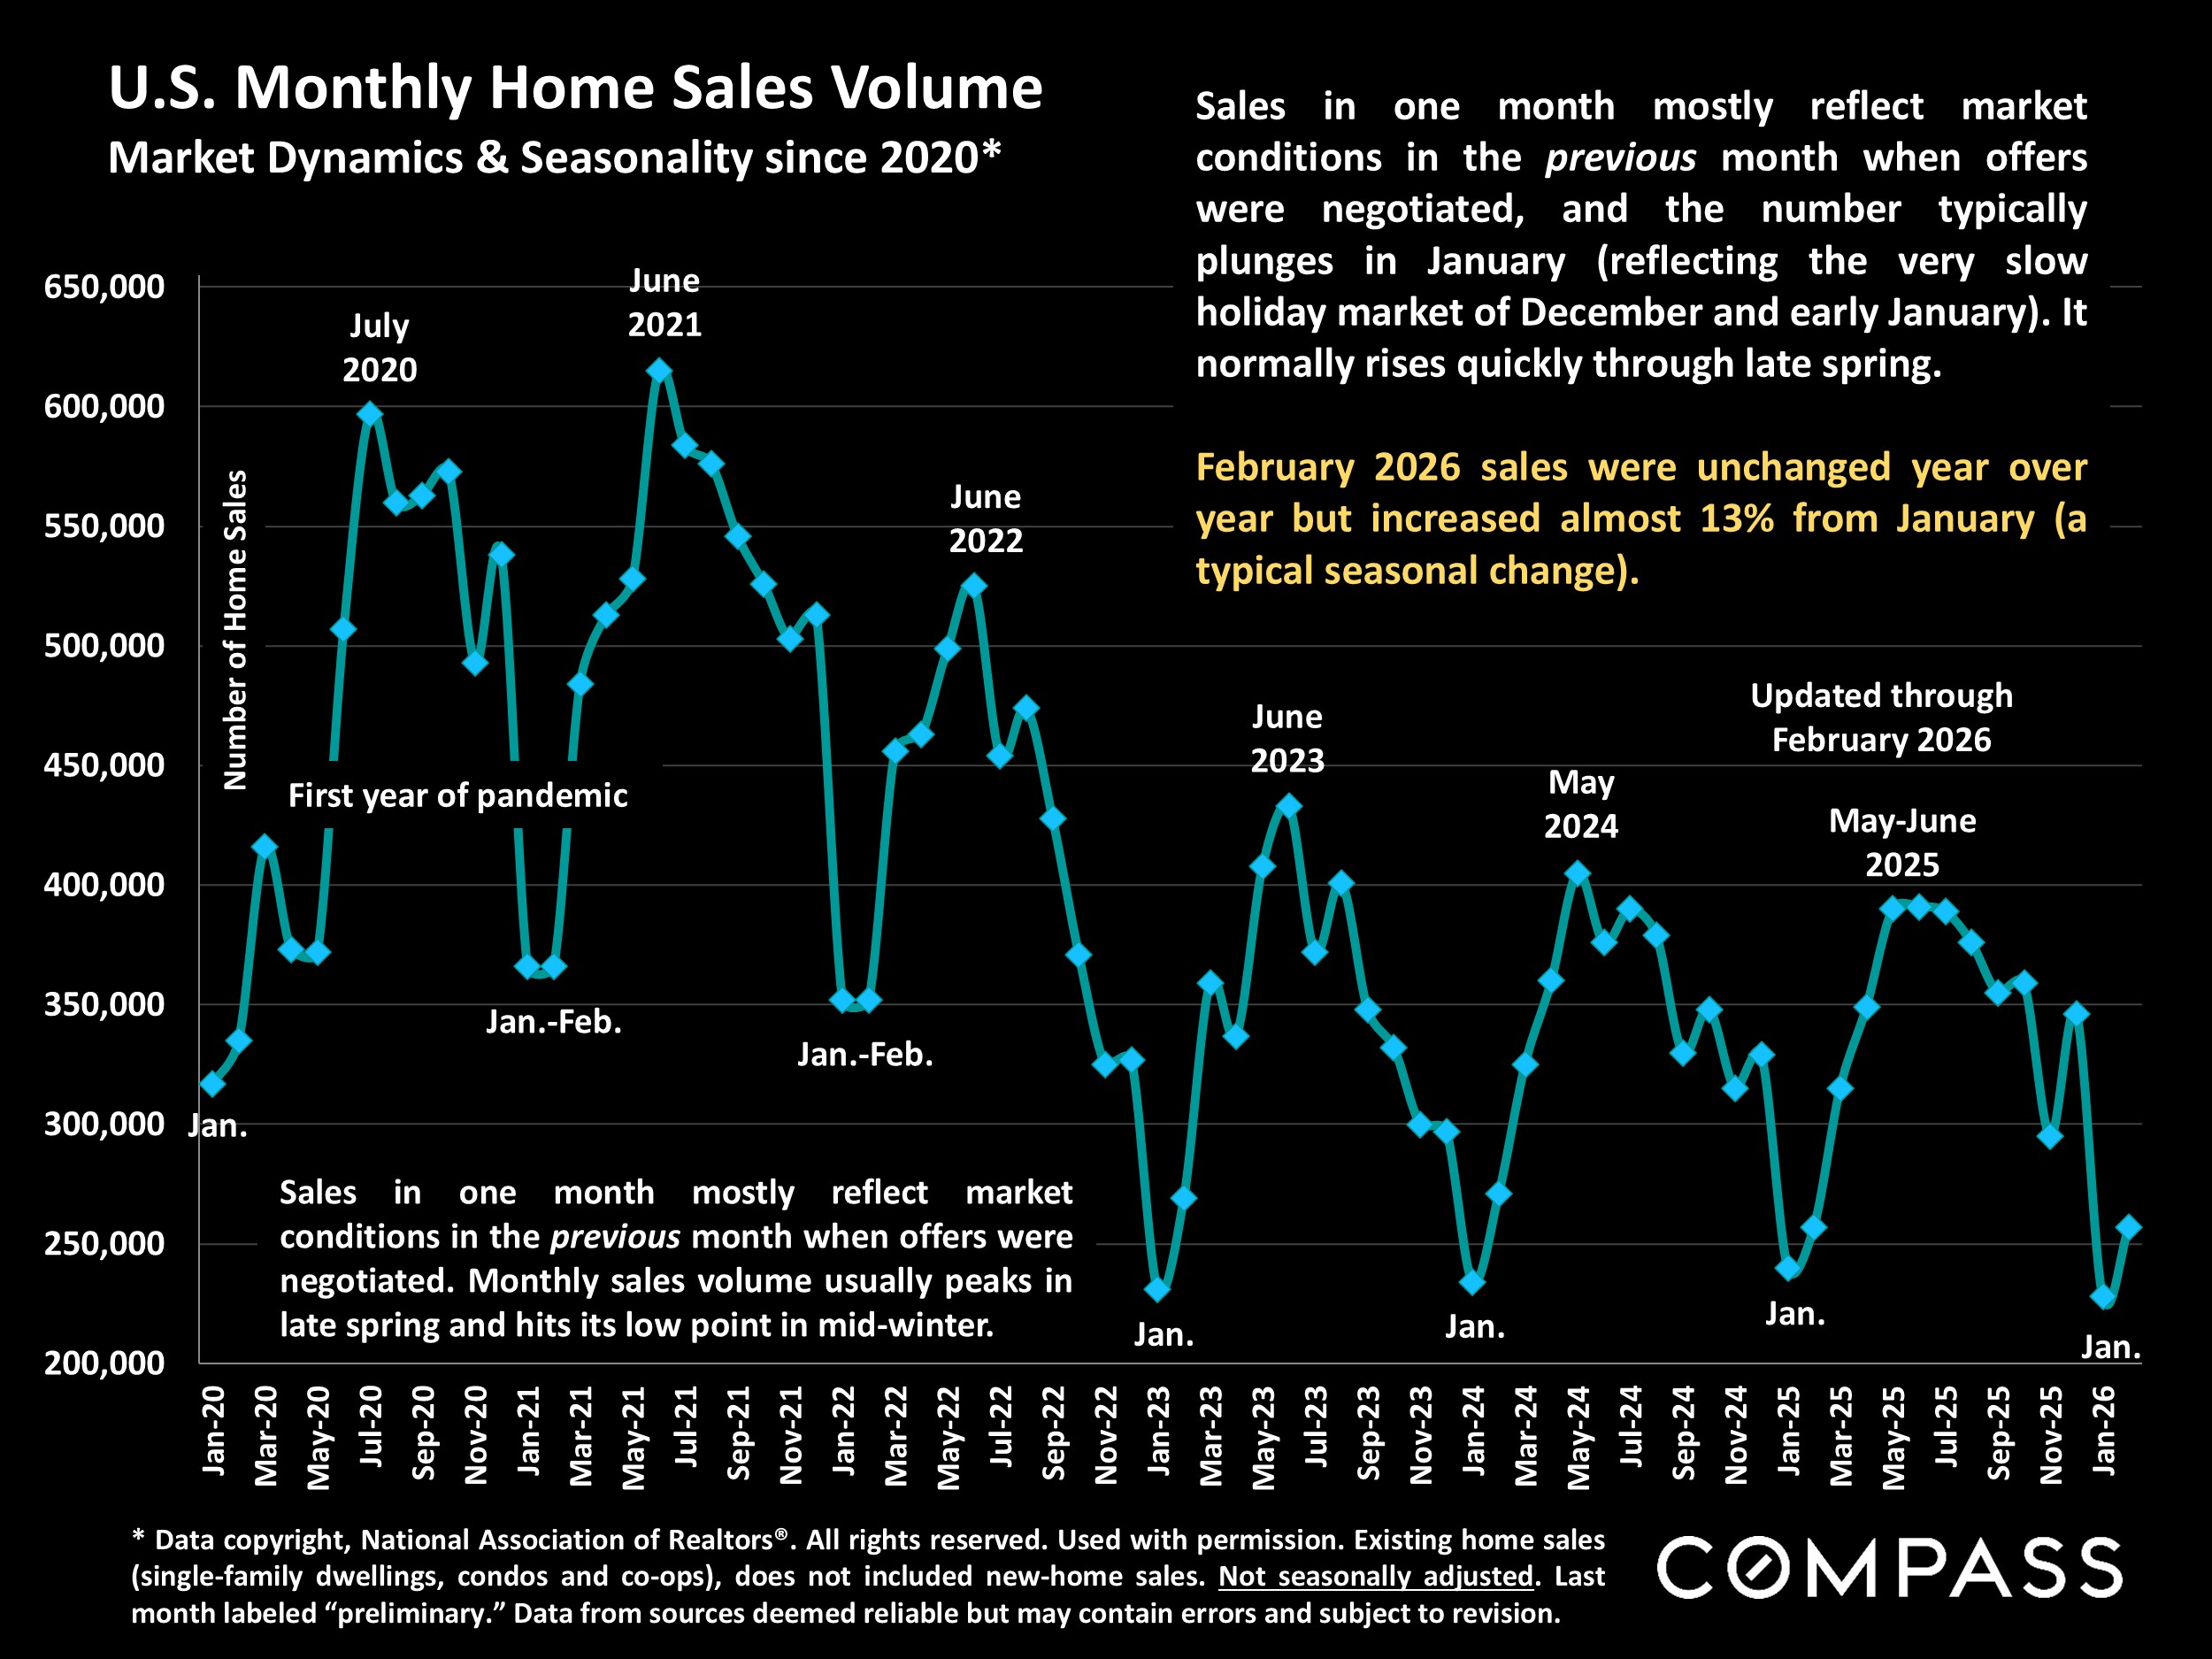
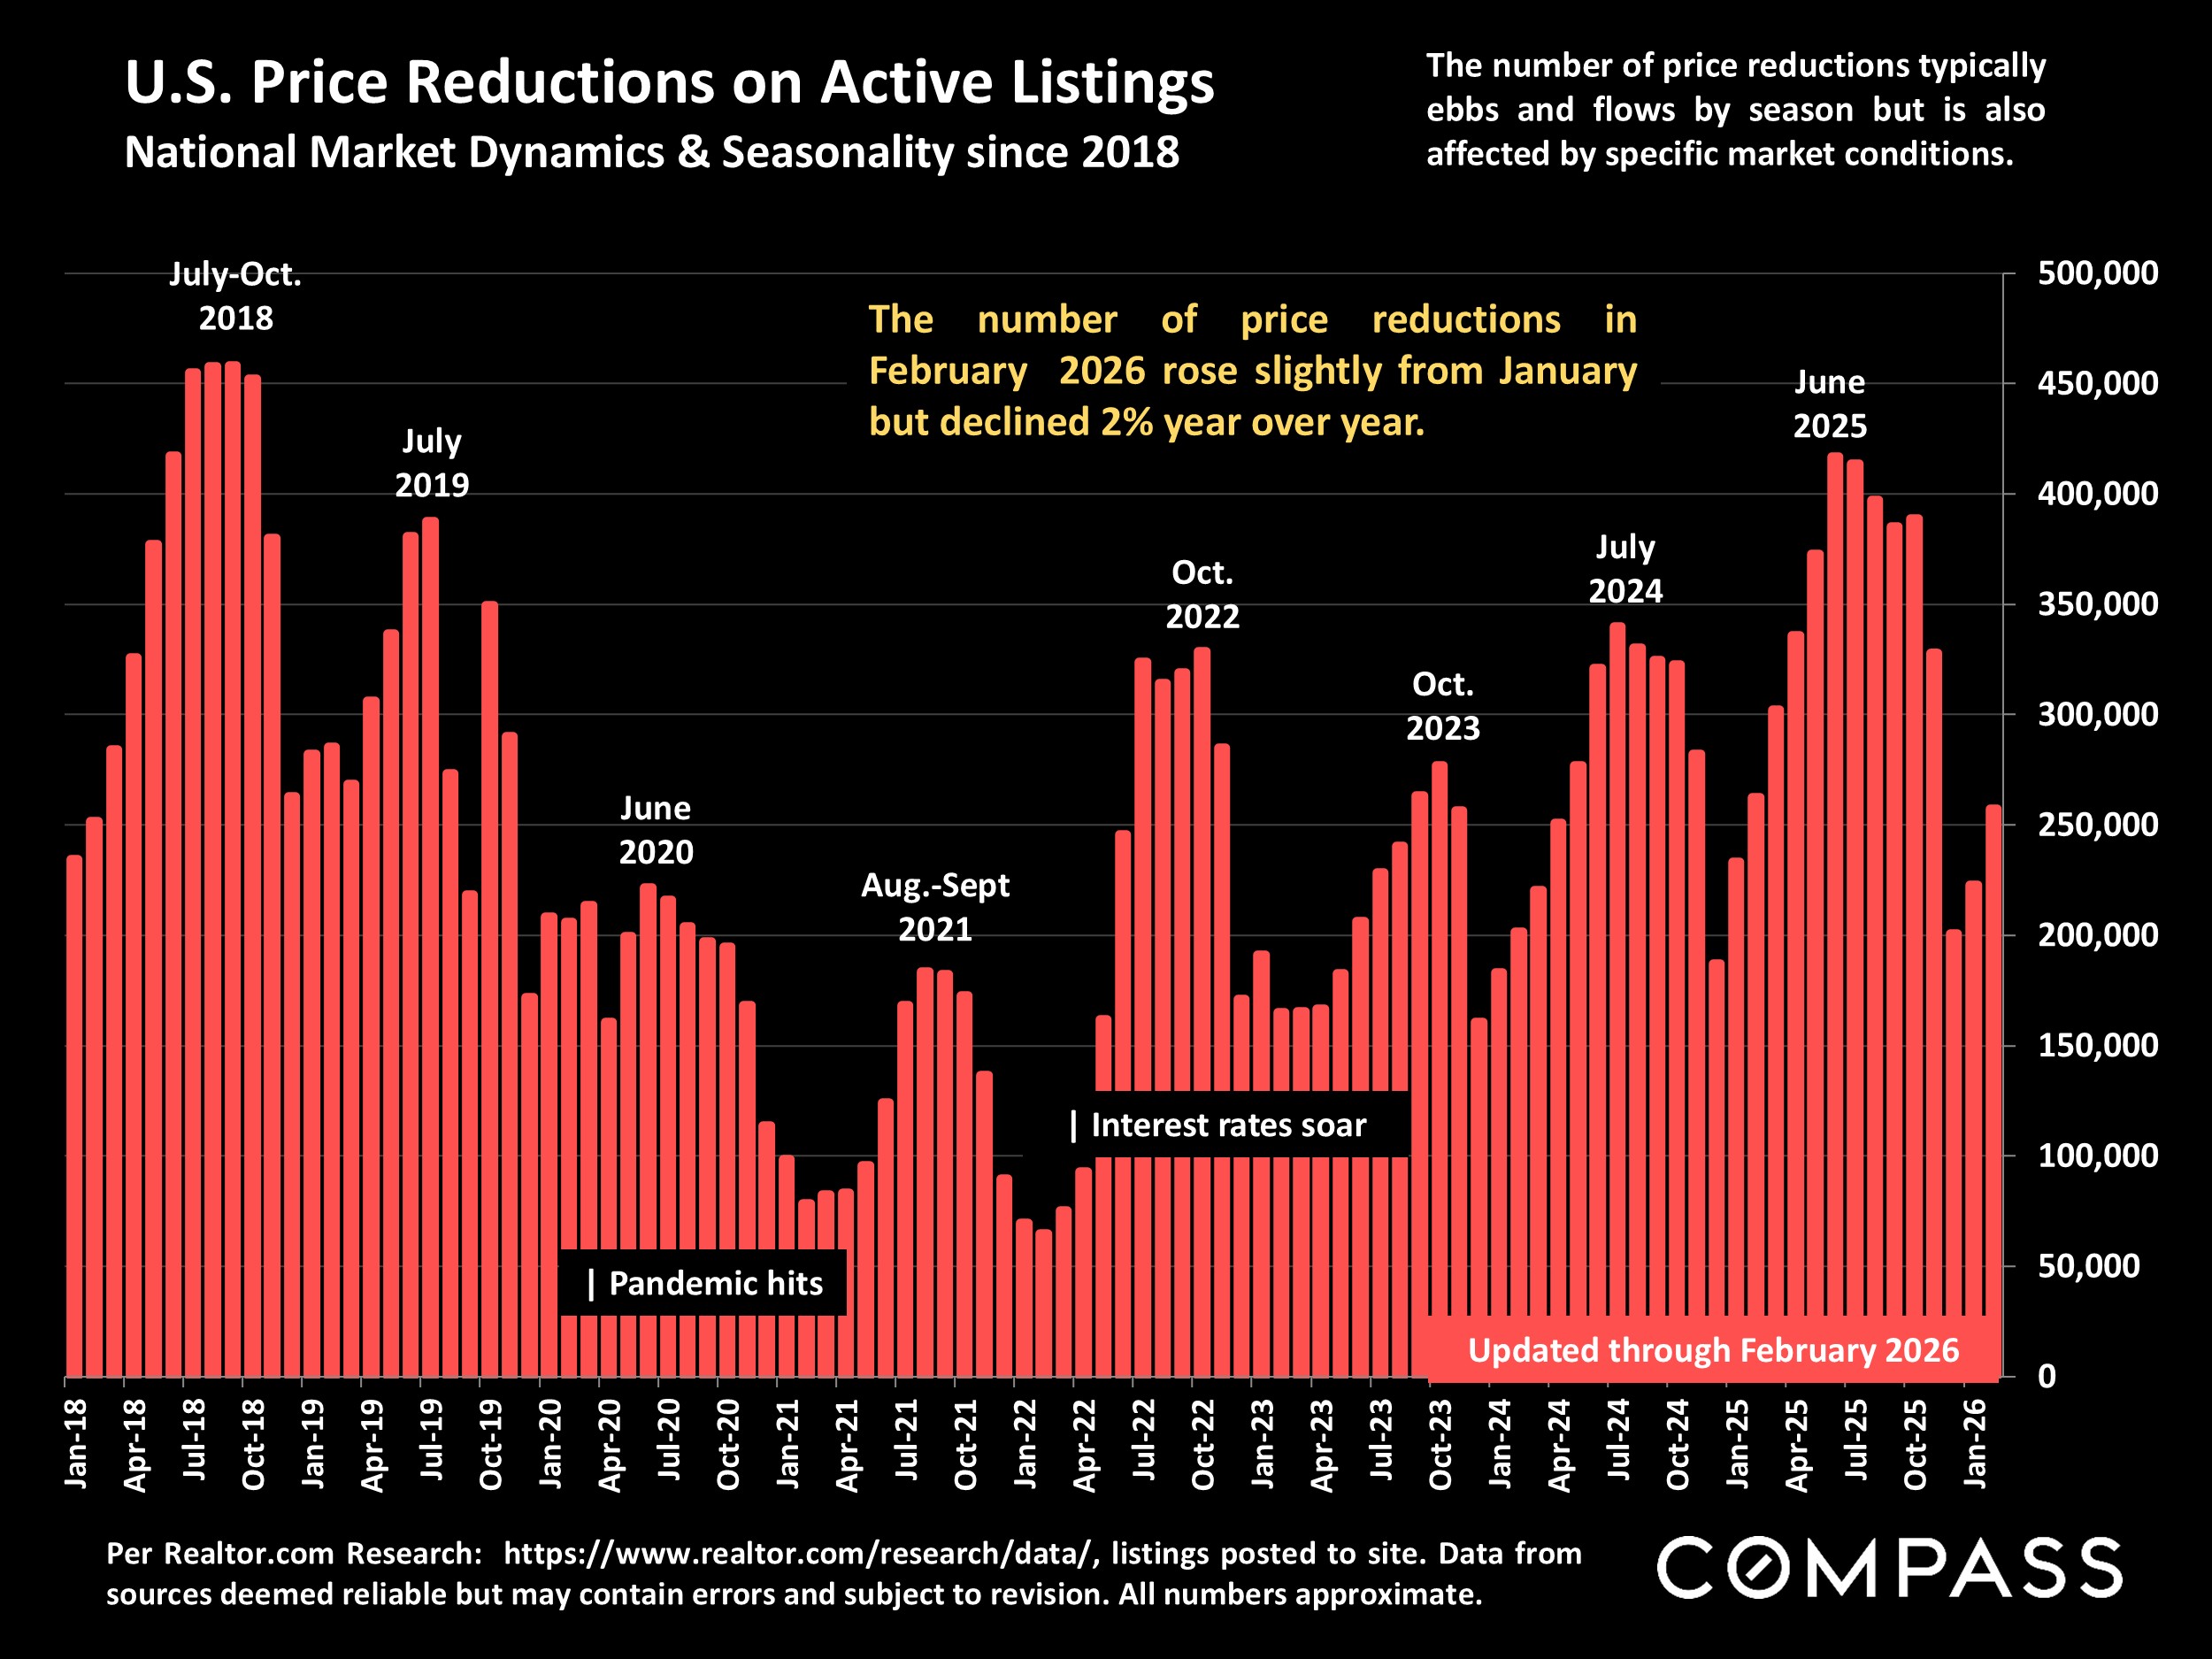
The median house sales price in February 2026 was essentially unchanged year over year (+.2%) 📊, as was the number of home sales 🏡. The supply of listings for sale rose 2.4% from January and 4.9% year over year 📈; median time on market until acceptance of offer was 47 days (up from 42 days) ⏱️; and approximately 14% of sales sold over list price (down from 21%) 💰. 20% of buyers waived their inspection contingency (down from 24% last year) 🔍; 8% of contracts had delays in close of escrow due to appraisal issues (up from 7%) 📑; and 6% of contracts in the last 3 months were terminated before close of escrow (up from 5%) ⚠️. An estimated 31% of listings sold for all cash 💵.
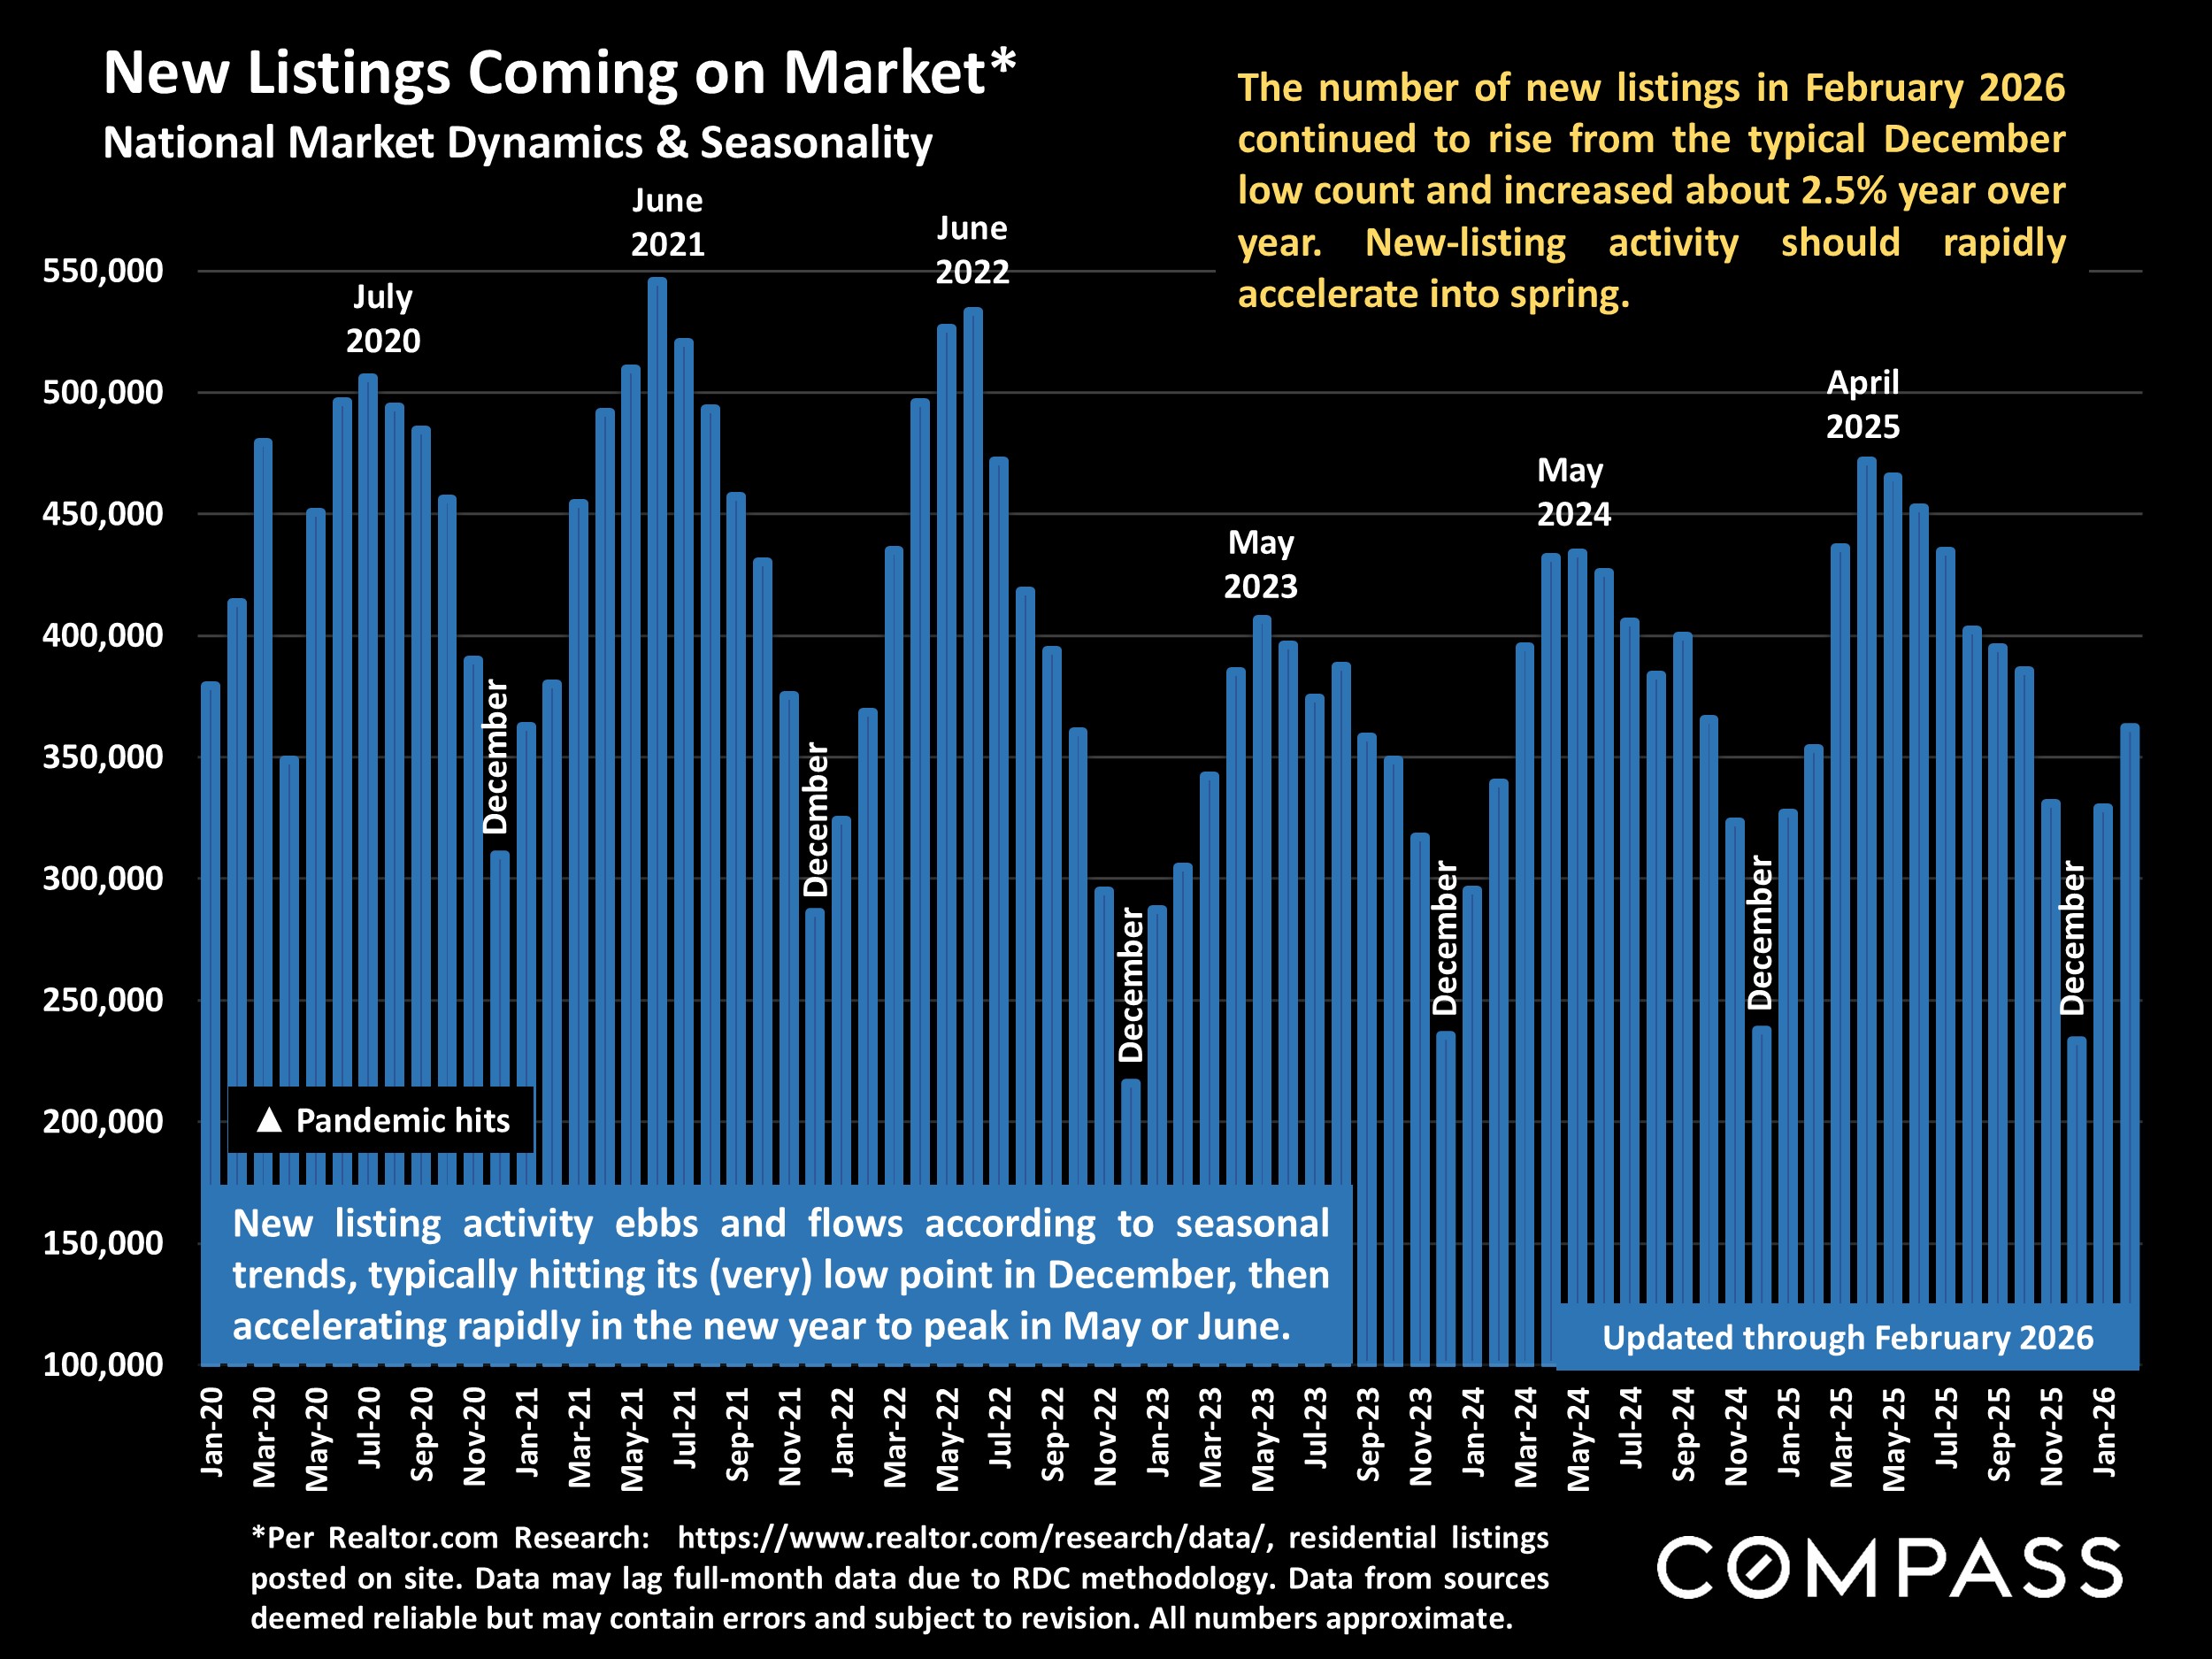
In most of the country, real estate markets were still waking up in February from the mid-winter lull ❄️ and often dealing with challenging weather conditions 🌬️. There were increases from January in the numbers of homes for sale and of listings going into contract 📋, but the more substantial rebound in new listings and buyer demand typically begins in March 🌷 and then accelerates moving deeper into spring 🌞. Last year, this dynamic was upended by April’s tariff shock 📉, which among other impacts caused the S&P 500 and Nasdaq to plunge over 12% in one week 📊, and the usual spring-market momentum was mostly lost.
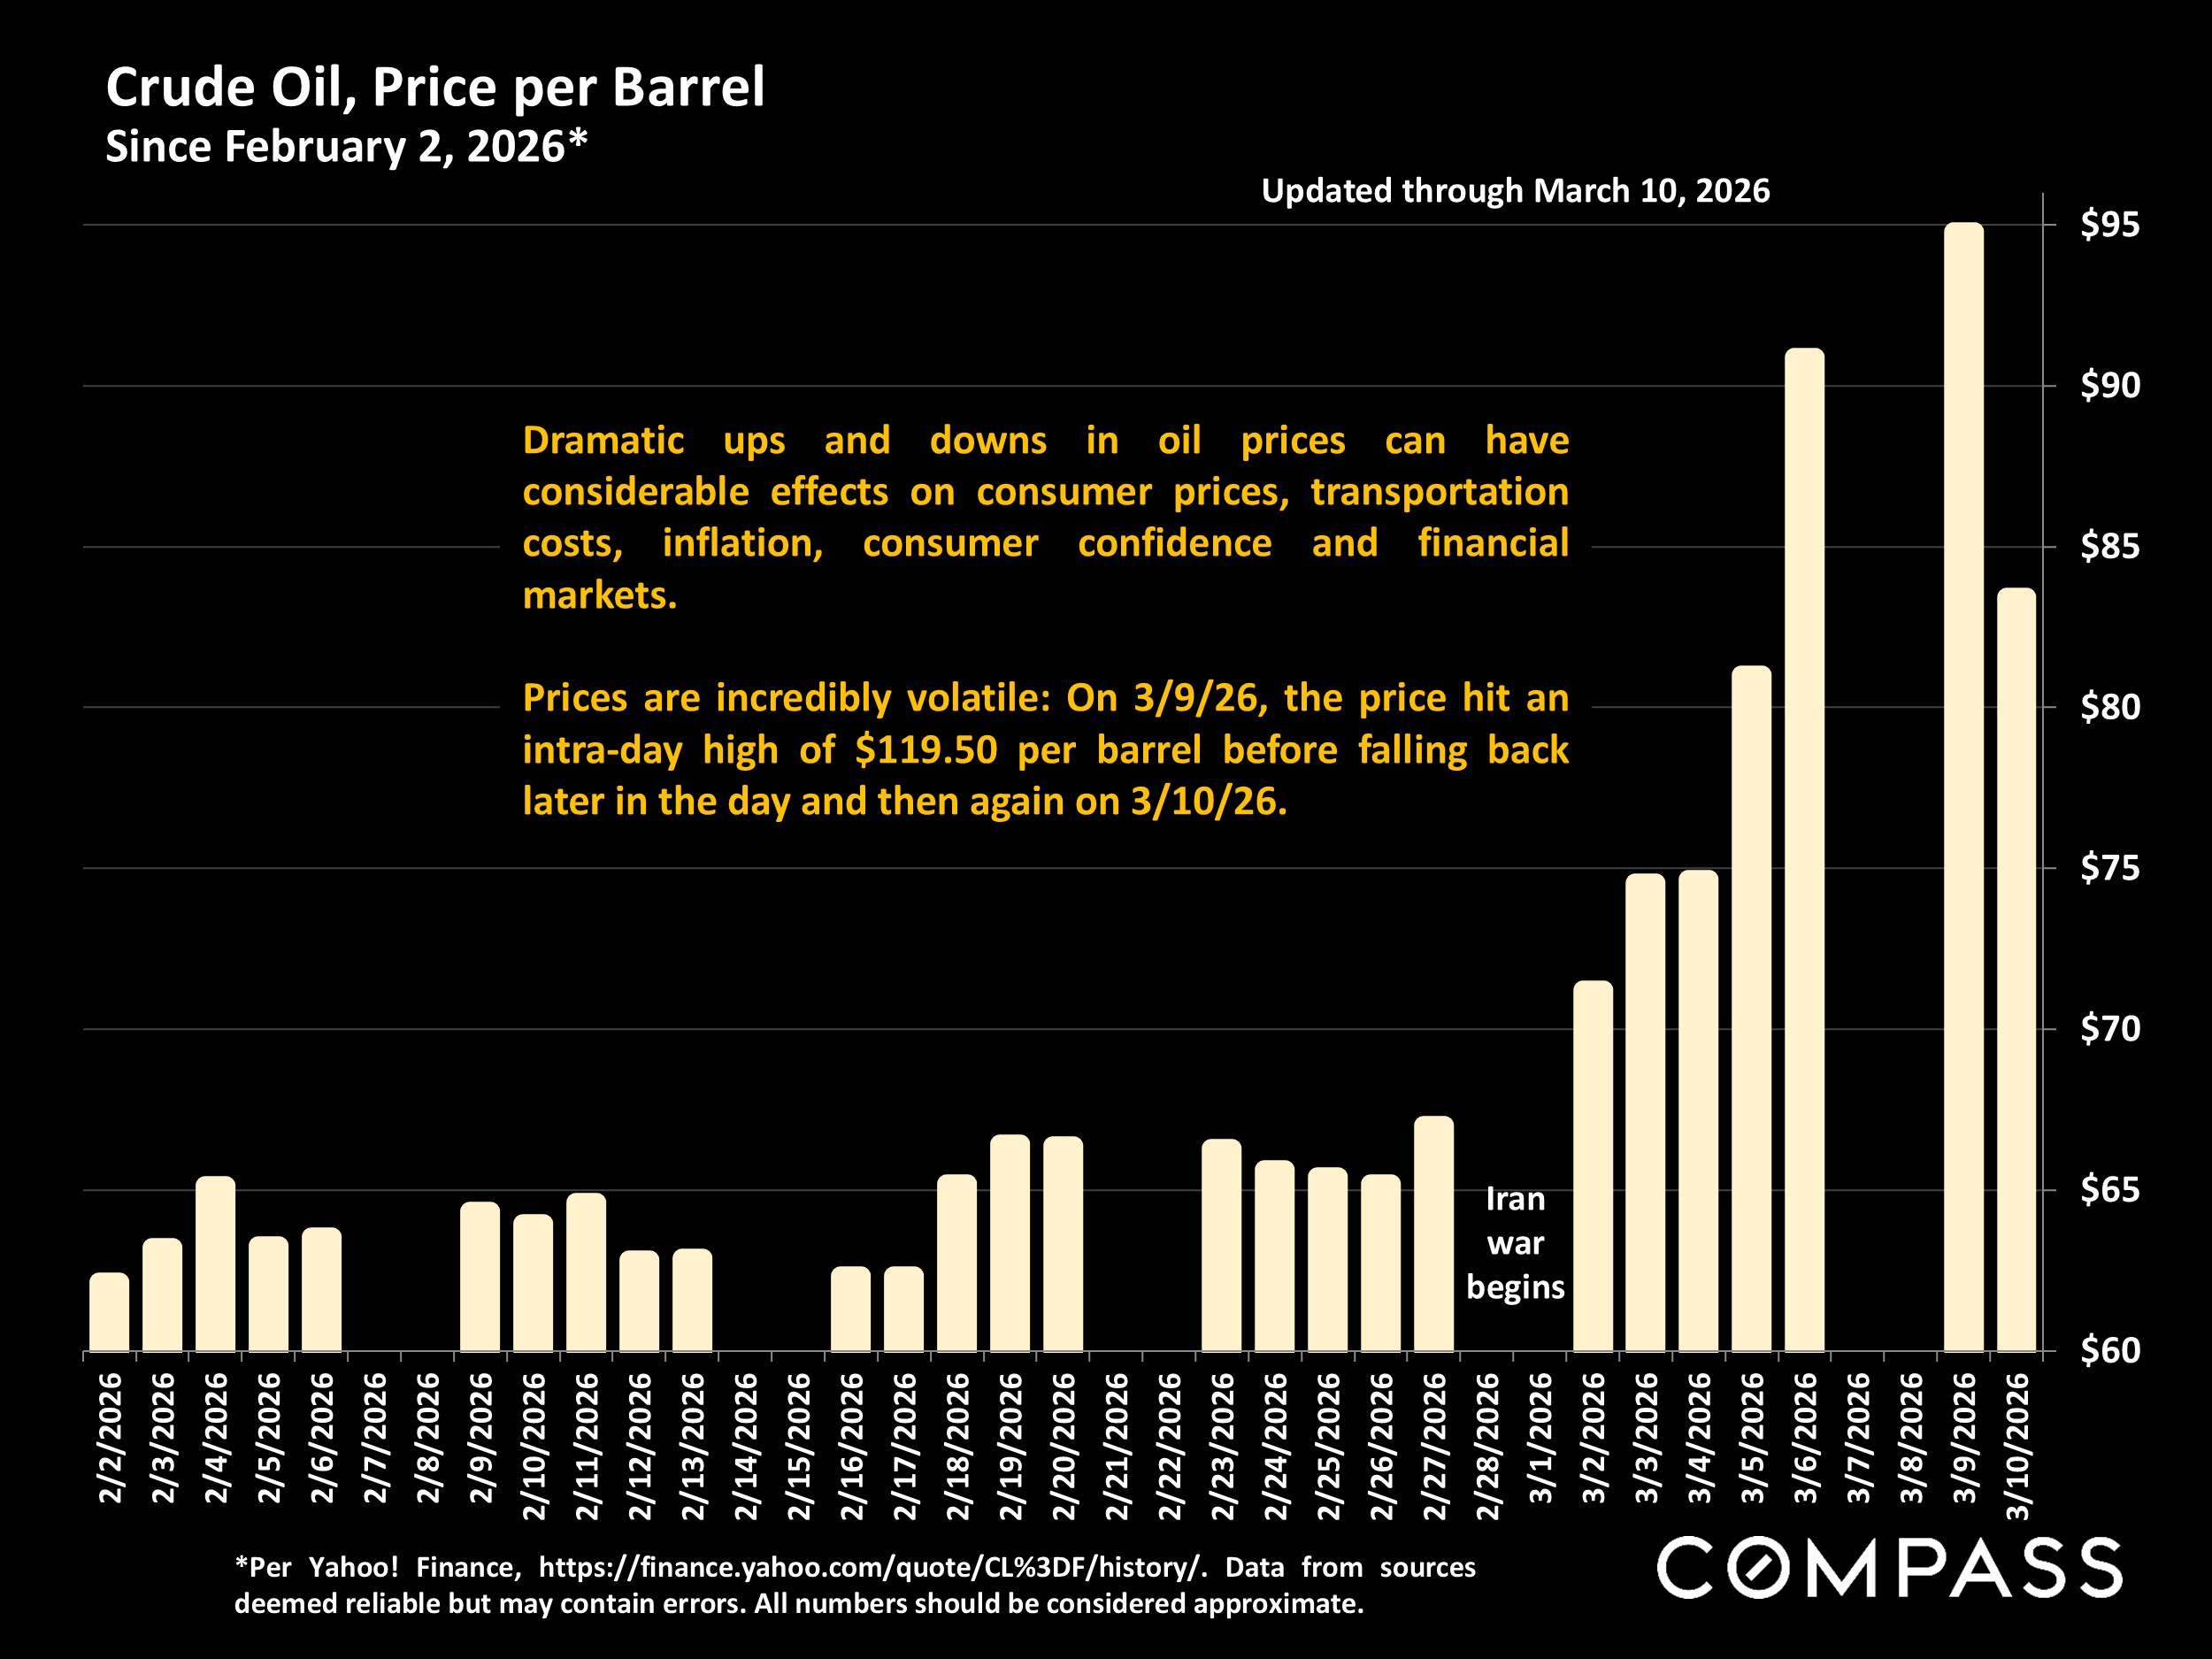
This year, the wild card is the possible effects the Iran war may have on inflation, interest rates, financial markets and consumer confidence 🌍. As of March 10th, there is substantial political/economic uncertainty ⚖️, but the situation may resolve itself relatively quickly, with little impact on housing markets 🏘️. For the time being, the oil price is gyrating ⛽ on 3/9/26 it ranged from $81/barrel to $119, stock markets are volatile 📉, inflation in February was subdued 📊, and mortgage interest rates remain near multi-year lows 🏦.
Want the full real estate market report delivered to your inbox each month?
📩 Contact us to be added to our monthly real estate report.

